


Eric Rignot: Investigating the Melt of the King Baudouin Ice Shelf
Prof. Eric Rignot from UC Irvine discusses his work following a successful field campaign on the King Baudouin Ice Shelf in East Antarctica during the 2024-25 BELgian Antarctic Research Expedition (BELARE).
Prof. Eric Rignot from UC Irvine discusses his work following a successful field campaign on the King Baudouin Ice Shelf in East Antarctica during the 2024-25 BELgian Antarctic Research Expedition (BELARE).
Prof. Eric Rignot is a Distinguished Donald Bren Professor of Earth System Science at the University of California, Irvine as well as an Academic Partner and Senior Research Scientist at NASA's Jet Propulsion Laboratory. His research focuses on the interaction of the Greenland and Antarctic ice sheets with global climate, using satellite remote sensing, airborne remote sensing, in-situ measurements, and climate modelling.
During his career, Prof. Rignot has made significant contributions to understanding the dynamics of glacial ice and the effects of climate change on polar ice sheets. He is featured in the recently released film, 2050, produced by Bargoens and financed by Syensqo.
We caught up with him after his return from a successful field campaign on the King Baudouin Ice Shelf in East Antarctica during the 2024-25 BELgian Antarctic Research Expedition (BELARE), based at the Princess Elisabeth Antarctica, the world’s first zero-emission polar research station.
What was the purpose of your trip to Antarctica this year?
The goal of our expedition is to see to what extent the warming southern ocean is melting the King Baudouin Ice Shelf in East Antarctica. When the ice coming off of a glacier on the continent flows out onto the ocean and starts floating we call this extension of the glacier over the water an "ice shelf”.
Melt that occurs on ice shelves is one of the main drivers of ice loss in Antarctica, so understanding how the ocean is eroding the King Baudouin Ice Shelf from below is key to understanding the mass balance of the ice sheet covering the continent and its impact on sea level rise.
Why did you focus your research on King Baudouin Ice Shelf in particular?
Because this is an area where we have a large ice flux from the continent flowing towards the coast.
Ice comes onto the ice shelf via the King Baudouin Ice Stream. It’s not an officially recognized name, but it’s the biggest glacier in the area and it is 800 metres thick. We want to follow where the ice is going. If you want to know the history of ice and how fast it melts with time, you have to track pieces of ice along their flow lines.
Another reason is the exceptional location of the Princess Elisabeth Antarctica Station. It’s in a convenient location to study the King Baudouin Ice Shelf. And the King Baudouin Ice Stream is accessible - not too full of crevasses. You can move around on foot and on skidoos. There aren’t too many places in Antarctica where you can study an ice stream and an ice shelf so easily. In other places you need more expensive logistics - planes, helicopters, ships, etc., to be able to do thorough enough research. You’re lucky if you can get to study one ice shelf in situ at least once in your career.
Near the Princess Elisabeth Antarctica Station, it’s possible for us to set up long-term observation stations. Scientists need to observe the environment for a long time and in detail in order to understand the physical processes at work and the evolution of the ice. It is essential to have a continuous data set over a long period of time to fully understand what’s going on. Most of this observational record currently does not exist, which limits our progress in understanding the evolution of ice and in turn to project sea level rise.
What did you do during your fieldwork this past season?
We set up five base camps starting from the front of the ice shelf, where it breaks into icebergs, going back 80 km to the grounding line, where glacial ice flowing off of the continent starts to float over the water as the ice shelf.
At each basecamp we had several objectives.
We did radar sounding surveys to understand the complex internal structure of the ice shelf and determine its thickness at various locations. We also conducted seismic surveys to measure the seafloor depth beneath the ice shelf, which has never been measured before in detail. We need to know both the thickness of ice and the depth of the ocean to understand how the ocean water interacts with the ice and melts the ice shelf from below.
At each basecamp we wanted to drill through the ice shelf to the ocean below to deploy a conductivity, depth and temperature (CDT) device. We wanted to document the kind of water that enters the cavity below the ice shelf and interacts with the bottom of the ice shelf - specifically to determine the temperature and salinity of the water.
However things didn’t go exactly as planned. We drilled two holes successfully and then lost the drill head in the second hole. But the drill was still experimental at this stage. It was challenging to drill through the ice shelf because there were thick, refrozen melt layers and ice refreezing more rapidly than we anticipated during drilling.
We did manage to do a number of CDT measurements at the front of the ice shelf, where it meets the ocean. We found that at the seafloor, 750 metres below sea level, the water is warm, at about 0.7°C. That might not seem warm to you, but by Antarctic standards it is warm.
The average temperature for Antarctic ocean water is -2°C. The salt in the ocean water lowers its freezing point. And the freezing point drops even more as you go deeper into the ocean; it drops by 0.75°C for every additional kilometre below the sea surface because of the increase in water pressure.
So, 0.7°C is well above the melting point of sea ice. And water stores a lot of heat because of its high heat capacity, so there is plenty of energy to melt basal ice in this sector.
The grounding line of the King Baudouin Ice Shelf has a depth of 700-800 metres. We wanted to verify that the warm water detected at the ice front at 750 m is able to reach the grounding line, but we were not able to do so. We’ll have to try again during another season.
As we couldn’t do all the drilling we had hoped for, we conducted more radar and seismic surveys, which revealed a lot of interesting features about the ice shelf.
What did these radar surveys reveal?
One of the key areas of interest is the zone around the grounding line, where the glacial ice from the ice stream on the continent becomes the floating ice shelf. We think this zone around the grounding line is where the interaction of ice with the ocean is the strongest. Given the extra time, we collected about six times more data in the grounding zone than we had originally planned for, and we made interesting discoveries.
For instance, we knew there are channels of concentrated melt near the grounding line that are aligned with the ice flow direction. But we also found channels that extend perpendicular to those, which was surprising as we do not know how they formed, as well as areas on the flanks of the channels that we call “terraces” because they have a perfectly flat bottom; these are other surprising features to find near the grounding line.
We also found an unusual melt channel on the west side of the ice shelf, which is deep and forms a bump at the surface. In general, a melt channel forms a trough, because the ice is thinner, so it floats at a lower elevation. Here, we found the opposite situation: the ice is thin at the centre but protrudes above the surrounding area at the surface. Our interpretation is that the channel is formed by compression forces by the glacier combined with high melt in the channel, which makes it thinner. We will investigate this relationship in more detail in the coming months.
Scientific curiosity drove us to investigate further. As a scientist, when you’re in the field, if you stumble on something surprising or unexpected, you want to measure more. You measure as much as you can and adapt your work plan accordingly. It’s most exciting and productive to do this while still in the field, which is why we analyzed our data almost daily when we returned to our base camp to refine our plans for the next day.
We also used to think that meltwater channels start at the grounding line, which is where the ice starts to flex and bend with the oceanic tides. This season, we found that this isn’t a necessary condition. We discovered a meltwater channel extending further upstream into the continental ice, at least 3 km. This means that seawater can follow more permanent conduits beneath the ice than those that open and close with the tidal cycles, sort of unknown permanent caves extended beneath grounded ice.
During a previous expedition in 2011, Belgian colleagues found a subglacial lake inside the ice shelf. No one expected to find meltwater inside the ice. We need to understand how these water pockets form, how their formation changes with time, and their influence on ice shelf stability. Similarly, the melt channel we found that extends far upstream creates a line of weakness to climate warming for the system.
Lakes forming inside an ice shelf is bad news because it makes the ice shelf more prone to break up. When this happens, the broken ice shelf lets a lot of continental ice flow faster towards the ocean, much like removing the cork of a bottle, and this rises sea level, or messes up the floor of your kitchen.
Do you have any hypotheses about where this meltwater channel could come from?
The channel could form on the lee side of a bump in the bedrock upstream that the glacier flows over. Perhaps this initiates its formation. Once that channel starts to melt, it might become a self-sustaining process.
Conversely, on other parts of the ice shelf we found terraces, i.e. areas where the bottom of the ice shelf is completely flat. On terraces, there is no buoyancy force driving ice melt; the ice shelf protects itself for further influence by the ocean. We were surprised to find them so close to the grounding line on an ice shelf, where meltwater flow is assumed to be turbulent, because we think terraces can only occur in places with low flow speed of the water - relatively calm conditions - yet we found them to form within a couple of kilometres of the grounding line.
We also found that melt becomes active over some section of ice, then ceases, then initiates again further downstream. It’s a phenomenon that we haven’t yet been able to document; ice melt varies tremendously on small spatial scales.
So do these cavities actually form behind the grounding line?
They normally form in the proximity of the grounding line. I saw one near the grounding line last season with only three radar transects. This year, using about 20 radar transects, we got a much better idea of the shape and extent of several cavities.
To understand their formation, we’ll need more observations of the seafloor depth and ice thickness, because we think these cavities form in regions favourable for more turbulent mixing, and these regions occur in places with favourable bathymetry. We will come back with more advanced technology to do this. We also hope to explore the cavity with automatic underwater vehicles (AUVs) during another season to get much finer details about the cavities. Our work this season was a first step in that direction.
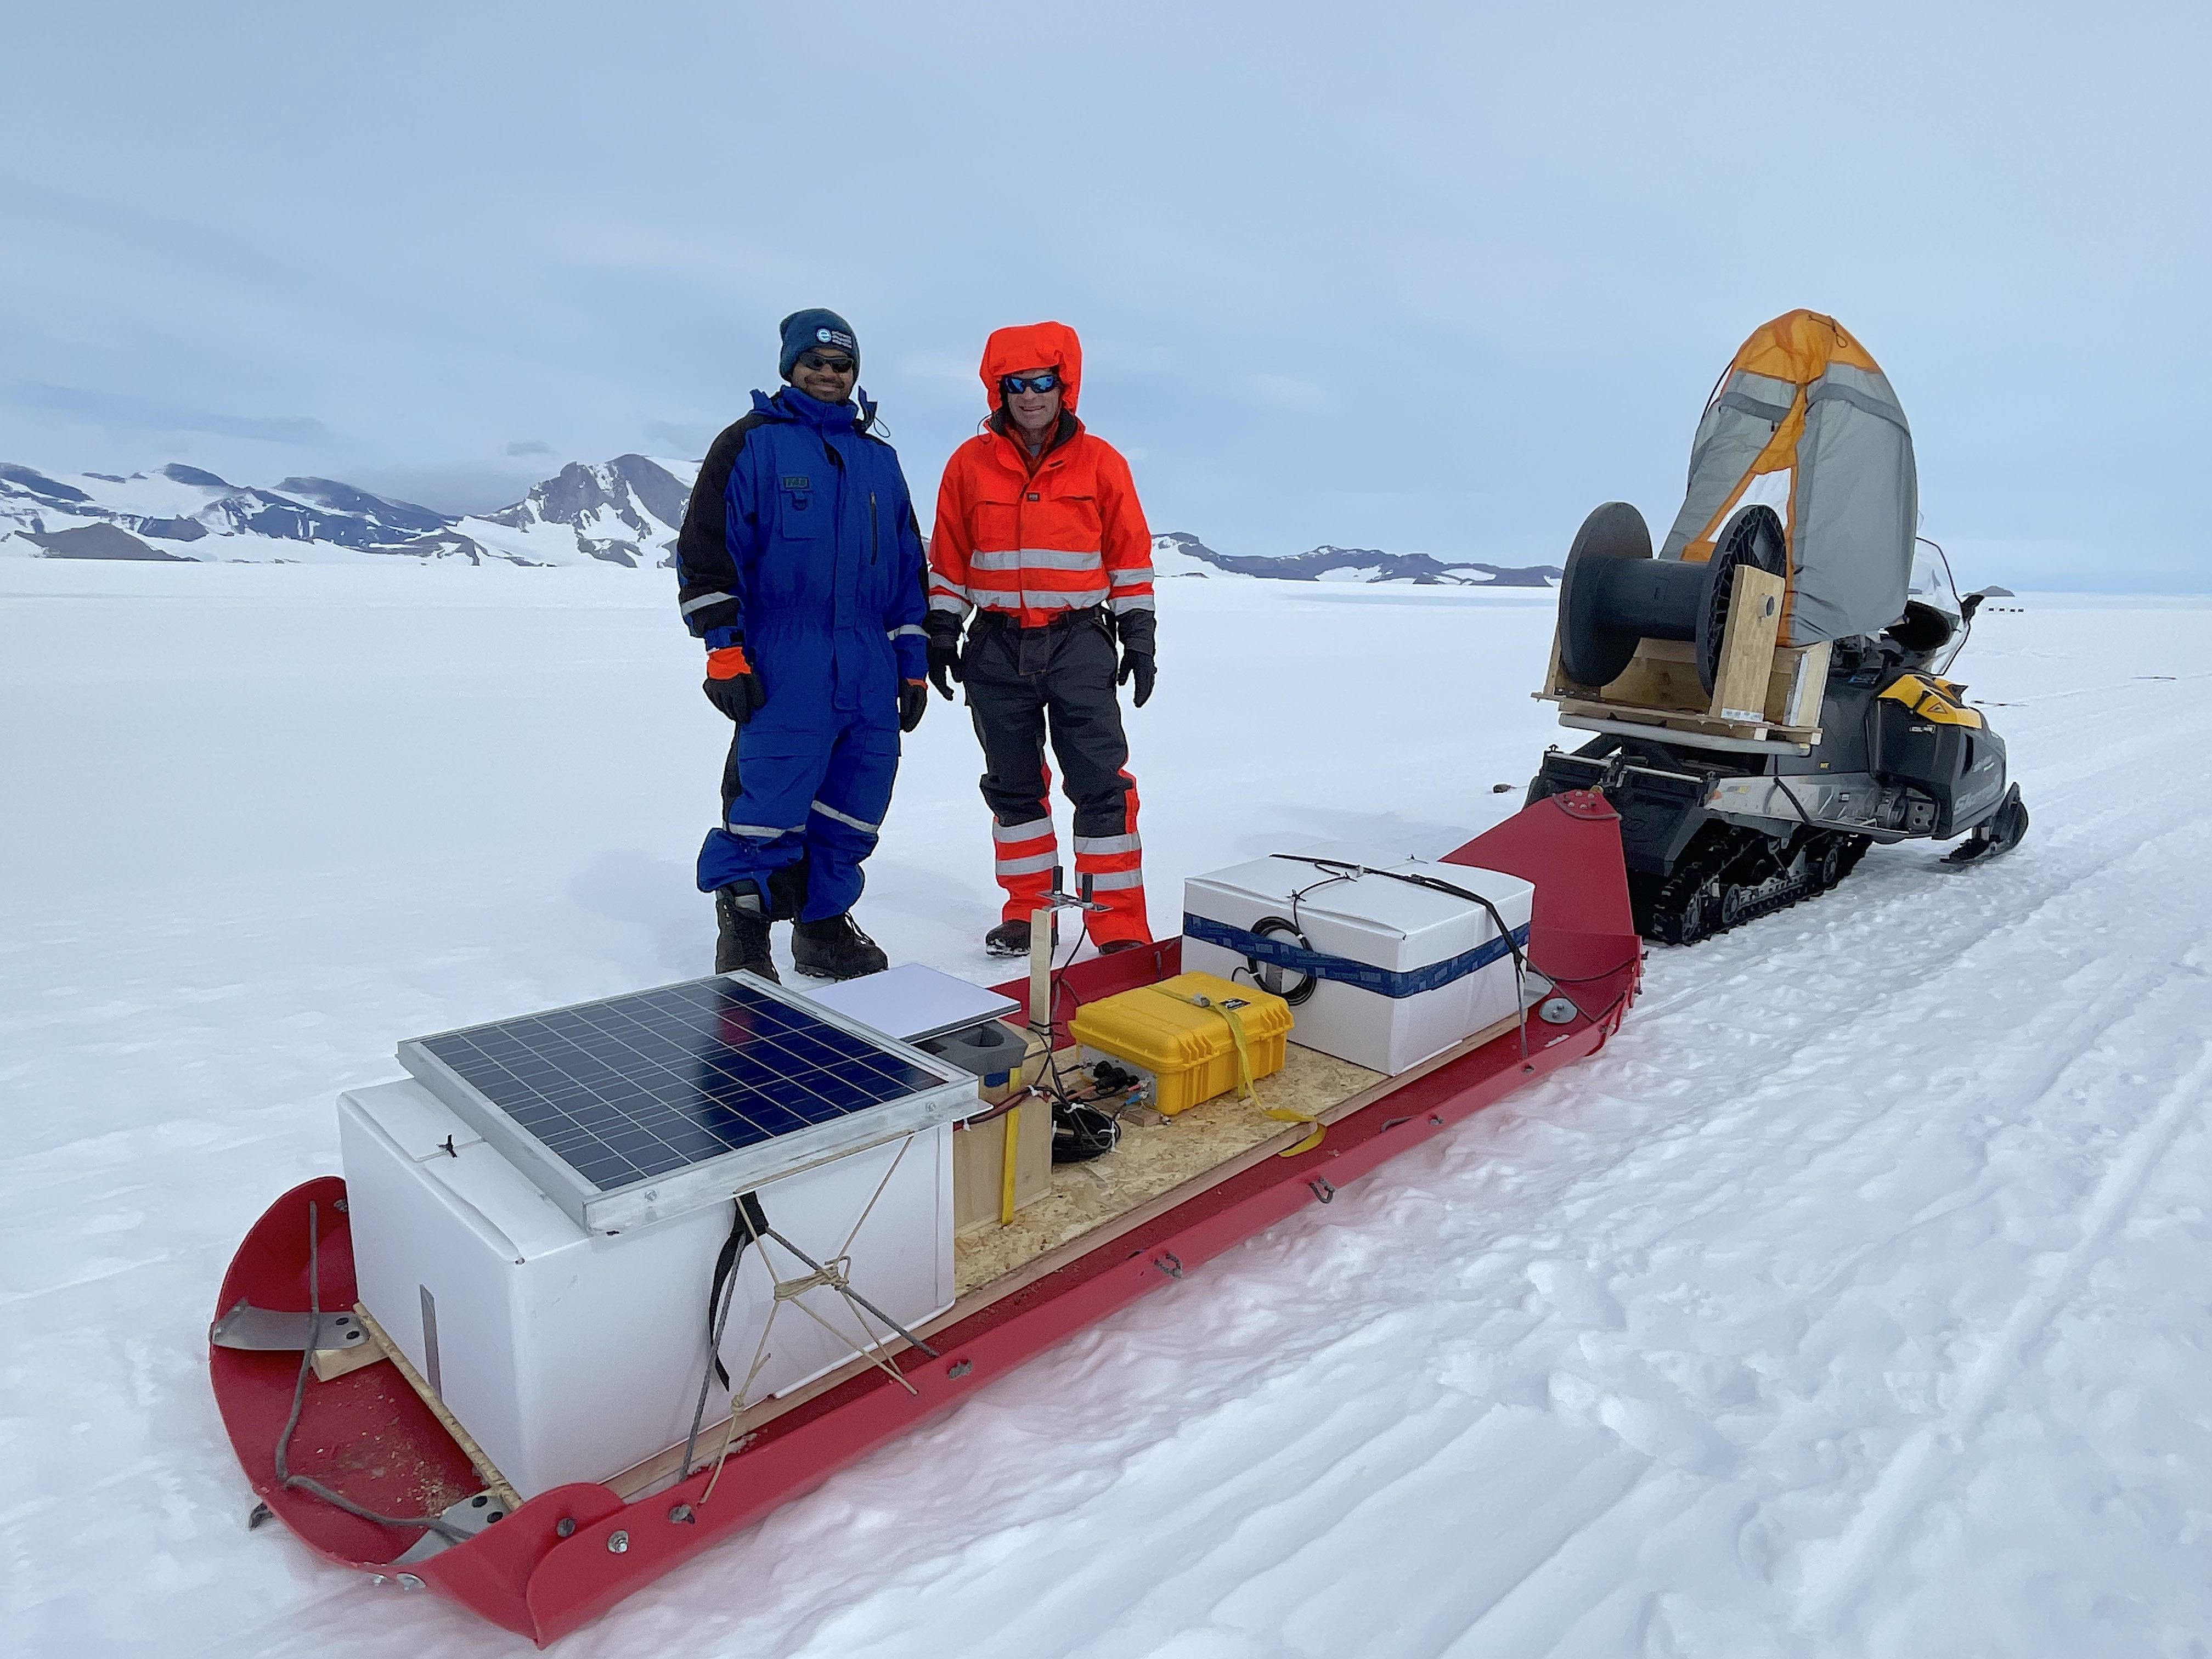
You used a sledgehammer to get seismic images of the ice sheet and sea floor below it. How does this work?
At different locations along the ice shelf, we placed 24 geophones connected by a 230-m long cable. We used a sledgehammer to strike the surface of the ice shelf and generate a sound wave that travels through the ice, into the ocean waters and back. The geophones recorded the echo of that noise from the bottom of the ice shelf and also from the seafloor. The echoes come back within one second. From these data, we estimate water depth and ice thickness.
It was amazing how well this works. This type of seismic imaging was traditionally done with small explosives. But following the advice of a colleague at the Norwegian Polar Institute, the technology has evolved enough so that even the sound of a sledgehammer hitting the ice surface is sufficient to hear echoes from the seafloor about one second later.
You also deployed a second automatic weather station this season. How do they contribute to your study?
The purpose of putting an automated weather station on the ice shelf is to understand the energy budget at the surface of the ice shelf and how melt is occurring. What are the driving processes? Short wave radiation? Long wave radiation? Wind? When does this occur during the year? It’s important to document this to understand how melt water forms and collects on the ice shelf.
During the 2023-24 season, we installed an automatic weather station on the grounding line of the ice shelf. We installed a new one in the middle of the ice shelf this season. We found extraordinary results about the timing and magnitude of melt events that we will report soon.
This part of East Antarctica is interesting to study. The Queen Maud Land in East Antarctica has seen an increase in snowfall since 2009, a feature that is somewhat unique in Antarctica and not yet well explained. And we also detect a lot of surface melt in this region, which is not expected by Antarctic standards. So it is a region where the rate of turnover of mass is high and changing with time, which is very interesting in terms of the impact of global climate on Antarctica.
You also installed a GNSS antenna. What does this do?
A GNSS is a fancy GPS station that listens to multiple satellite systems to get a precise position on the ice. We deployed it on the ice shelf next to the automatic weather station to detect horizontal or vertical motion of the ice shelf to calibrate and validate measurements to be made by a new satellite mission called NISAR (NASA-ISRO SAR), a joint synthetic-aperture radar mission between NASA and the Indian Space Research Organisation (ISRO). The satellite will be launched in July 2025. It will be the first synthetic aperture radar mission that covers all of Antarctica coast to coast for many years, continuously.
With NISAR, we will be able to look at the movement of the ice in great detail.
What did you do with your radar equipment at the end of the field campaign?
We left it on the ice near the grounding line. We buried it in the snow in a sealed box that looks like a coffin at the boundary between the ocean and the continent. It takes measurements every hour. It’s a precise radar instrument that detects changes in ice thickness down to a few millimetres. The radar is an autonomous phase-sensitive radio-echo sounder (ApRES) built by the British Antarctic Survey (BAS). My BAS colleague Keith Nicholls is a collaborator on this project. It will be left there for a year to see how the thickness of the ice changes with time.
We had one there at the end of the 2023-24 field campaign and we recovered it this year to get the data it had collected over a year. It had a solar panel on the top to recharge the battery, which allowed it to continue functioning for an entire year.
You can see the coffin where we deployed that radar in the 2050 film.
This year we found the coffin 2 metres below the surface under multiple ice layers, meaning there had been periods of melt since it had been deployed. We were also surprised by the amount of snow accumulation on top of the box, about 50-80 cm.
We plan to bring more automated radars to the ice shelf in the future to document ice melt.
Are you happy with what you were able to accomplish?
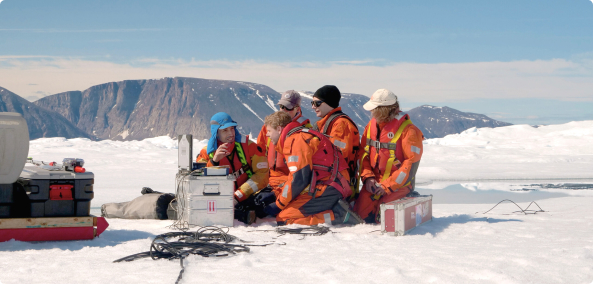
Absolutely. We had a small team of four people, but everyone did a great job and conducted the work safely.
For most of my career I’ve analysed satellite data. I’ve done research pole to pole from planes and boats, but I have less experience in the field. This was the first time I camped on Antarctic ice for 24 days. I was not sure how to handle it, but the weather was good. We were not in the coldest part of Antarctica, or there during the coldest season. After a week we were already in a good rhythm.
The staff at PEA has from the beginning been very supportive of our expedition. They helped prepare the logistics, transport, meals, and camps for us. Our field guide didn’t just take care of our safety, he also helped collect measurements. It’s a team effort where everyone brings his/her own expertise. We could fully trust our equipment and logistics, which is important so we can focus on good data collection.
We had a nice living container with a kitchen and internet. We could cook and have a good amount of comfort for 24 days and work efficiently. For instance, we could back up our data online on Google Drive daily via the Internet. Access to the Internet in the field changes things profoundly not just in terms of safety, but also efficiency and makes it possible to conduct most of our analysis while still in the field. At one point, we wanted to do some thermodynamic calculations for our drill. We logged on, used ChatGPT, and got an answer within one minute with equations, numerical examples, and trends. And ChatGPT was correct.
Before we close, I want to take this opportunity to thank all the people in Cape Town and at PEA who contributed to this expedition, made this work possible, and allowed us to work safely and in accordance with the Madrid Environmental Protocol of the Antarctic Treaty System.
Are you planning to go back next year or in the coming years?
We haven’t discussed the exact details yet, but most likely yes. We see this as the beginning of a more ambitious observatory of ice shelf melt in Antarctica and we see this region as a unique laboratory to study fundamental physical processes controlling the evolution of the Antarctic Ice Sheet and its impact on current and future sea level change.
Download